After the bond sale, how much intermediation capacity is still occupied?
To understand Treasury-market capacity, follow obligations through time rather than treating turnover as released room.
On October 30, 2026, a Federal Reserve staff study found that issuance-related client financing persisted longer than inventory effects. It is historical analysis, not a current capacity reading. Study
That observation invites a practical question about the way market capacity is described. A securities transaction can finish while another commitment connected with it continues. For a public-market reader, the useful unit of analysis is therefore a sequence of obligations, with dates and release conditions, rather than a single successful sale.
The New York Fed describes primary dealers as trading counterparties with Treasury-auction bidding expectations. Institutional background Those responsibilities make the distinction between completing a transaction and freeing resources worth examining. The argument below is Open Market Notes' analytical framework, not an additional empirical finding attributed to the study.
Follow a cohort beyond its sale
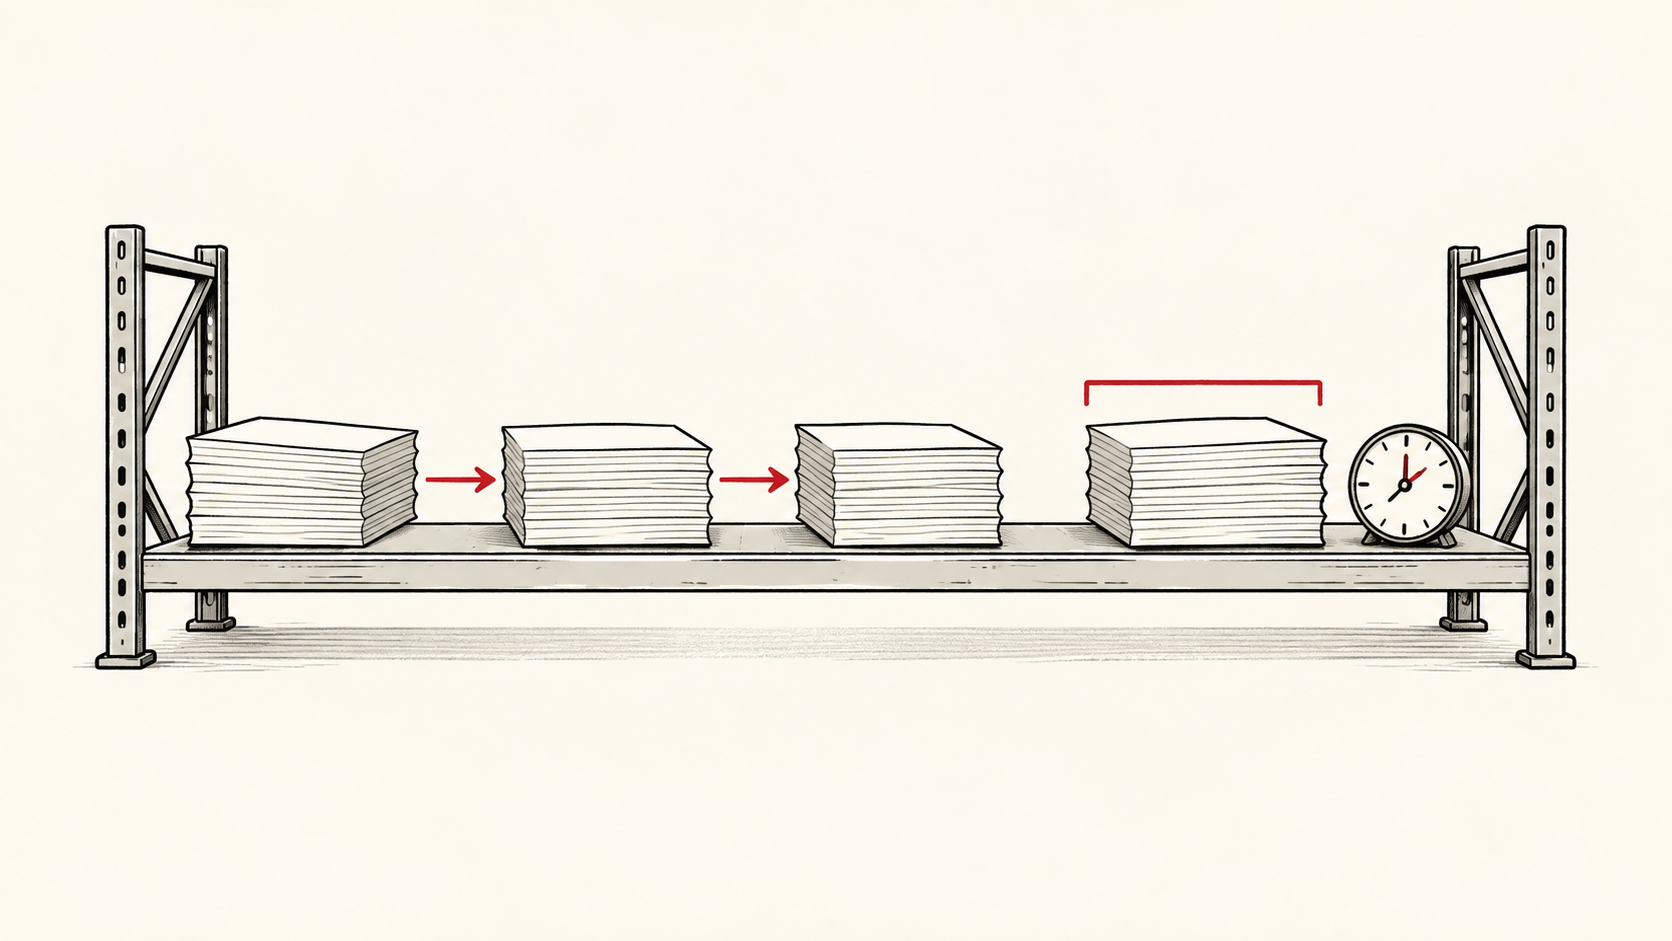
Consider an invented dealer operation that receives a batch of bonds on Monday and sells it by Wednesday. If the observation stops on Wednesday, the distribution process appears complete. Now suppose a separate agreement supports a purchaser's position until the following Monday. That agreement belongs on a different line of the record, with its own termination condition. Its presence does not prove that the sale was ineffective; it means that the sale and the remaining service answer different operational questions.
A useful record would follow the same issuance cohort from allocation to settlement, subsequent distribution and the end of associated commitments. The point is not to add every leg into a larger headline number. Some entries may represent opposite sides of the same financing arrangement. The purpose is to explain which resources remain committed after particular transactions finish, using a consistent accounting perimeter.
This distinction also changes the interpretation of turnover. A desk might process more securities through the same visible inventory while doing more continuing work for customers. It might instead process more volume because genuinely less time is needed for each transaction. Both cases can produce impressive activity totals; only the second necessarily implies faster release of the particular resource being measured. Which case applies requires evidence beyond turnover itself.
A finer record also preserves each cohort’s identity. New obligations can replace completed ones while the aggregate balance stays flat. A net figure can hide the speed and conditions of replacement, while gross activity can hide the unfinished stock. The two records should explain each other rather than compete to be the only measure.
Put amount and duration in the same picture
For a management thought experiment, compare two otherwise identical commitments of 100 units: one lasts a day, the other lasts ten days. Their starting amounts match, but the second overlaps more opportunities to accept new business. A simple amount-times-days measure can make that difference visible. It is a descriptive aid, not a regulatory capital formula or a claim that all exposures consume resources linearly.
Different constraints may bind at different times. A risk limit, a settlement window and a customer-service obligation need not expire together. Before calling one measure “capacity,” an analyst should identify the decision it is meant to inform. Room to accept another trade today is different from room to support a customer relationship through a busy week.
Averages can conceal the overlap that matters. Even when individual commitments normally end on time, several large cohorts can coexist during a narrow period. Conversely, a substantial outstanding balance may be well matched by stable resources and predictable end dates. A larger balance alone does not establish stress. It becomes informative when paired with the timing, flexibility and conditions of the resources supporting it.
Compare explanations before drawing a conclusion
If activity rises while reported inventory falls, one possible explanation is better distribution. Another is that work has moved into a different service or reporting category. A third is a changed mix of customers and transaction sizes. These possibilities are not interchangeable, and a quarterly snapshot cannot choose among them by itself.
A stronger comparison keeps the observation window and organizational perimeter fixed, then separates new commitments, completed commitments and changes in classification. Analysts can ask whether a cohort releases resources at the same pace under different business conditions. They should also check whether unusually easy periods dominate the comparison. This is a proposed method of inquiry, not a claim that any named dealer has failed it.
There is a business trade-off here. A continuing customer service can occupy resources and still be worthwhile. The relevant assessment would compare its economics and obligations with the alternatives forgone, rather than label every persistent commitment a problem. Equally, attractive activity growth need not settle the question of how much additional business can be accepted safely.
The study provides a reason to inspect the life of an obligation more carefully. It does not provide a real-time ceiling for the market or a direction for bond prices. A persuasive account of intermediation capacity should show what enters the system, what actually ends, and what remains in service between reporting dates. That is the evidence needed before translating a busy market into a claim about spare room.
Information only. No investment, legal, tax, or financial advice.