Why Microsoft’s backlog surged year on year but barely moved sequentially
The annual and sequential comparisons ask different questions about how new work replaces earlier commitments.
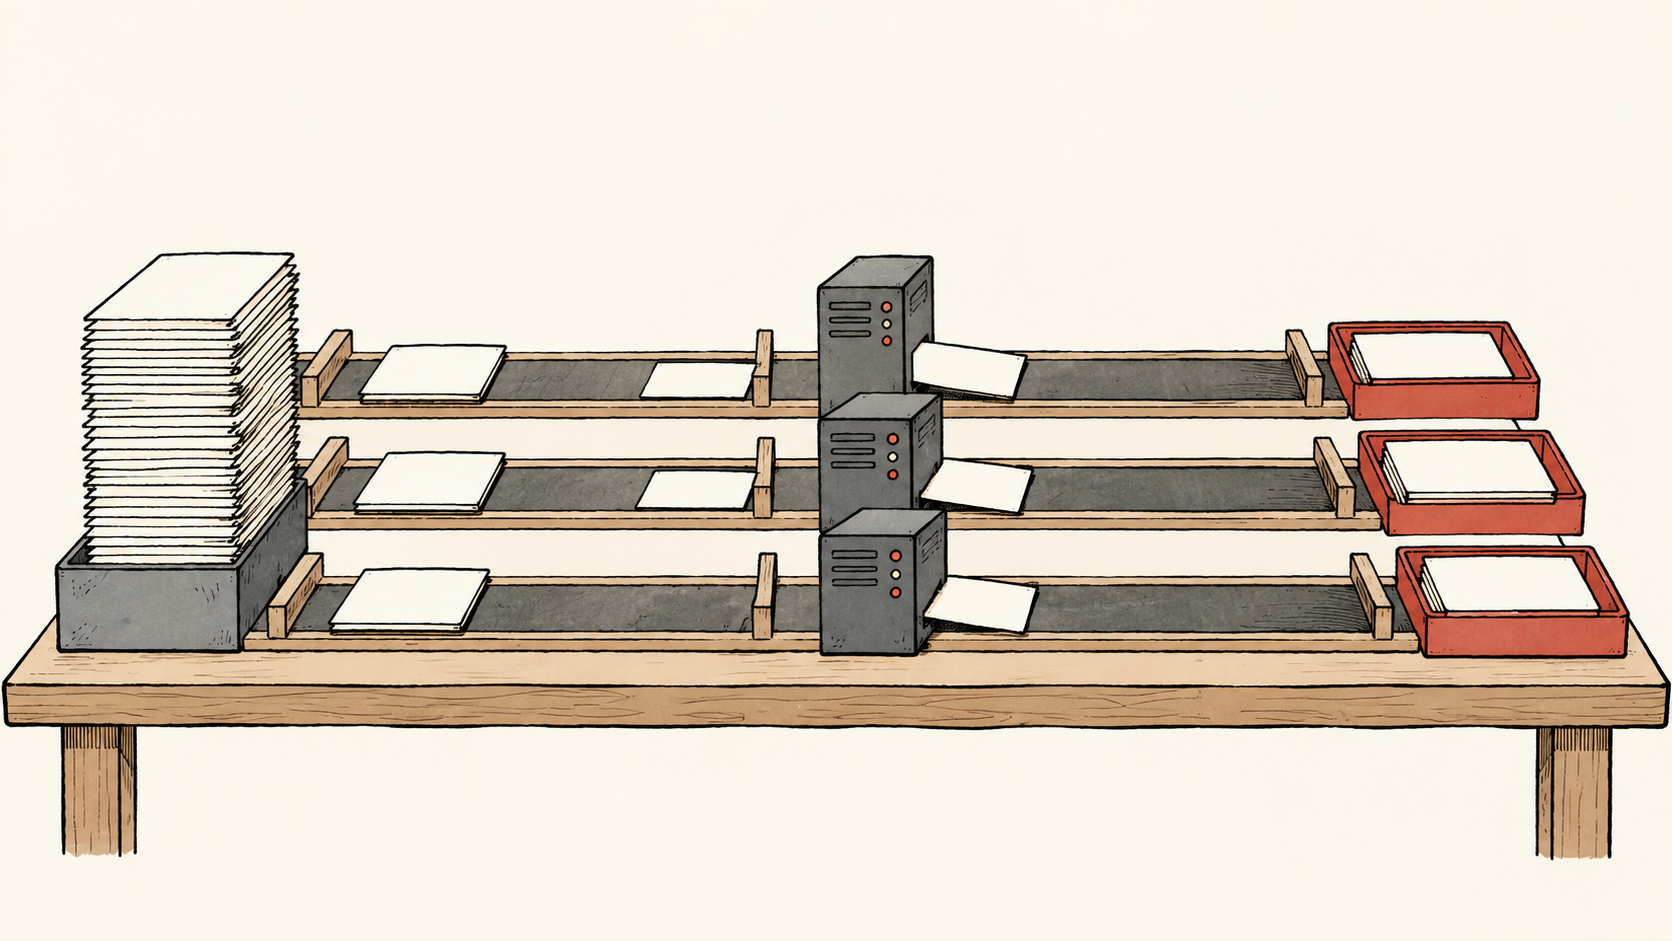
Microsoft’s October 28, 2026 FY2027 Q1 release reports commercial remaining performance obligations (RPO) of $677bn, up 73% annually. Its metrics show $678bn previously and commercial bookings down 12% annually.
These comparisons describe different parts of the same business. A large accumulated commitment balance need not mean that new commitments are accelerating today. Yet a nearly unchanged stock need not mean work has stopped. The question is how the earlier accumulation and current activity connect.
Put the comparison periods on the same page
A wholly hypothetical sequence illustrates the issue. A supplier’s contract balance was 100 a year ago, 170 last quarter and 169 this quarter. It still has 69% annual growth, but the latest quarter has not extended the earlier expansion. There is no numerical contradiction; the observation windows differ. Treating annual growth as the present pace of new contracting would mistake accumulated changes for current activity. This example does not estimate Microsoft’s contract flows.
It is therefore premature to call a large annual increase evidence of continuing demand acceleration. Calling an almost unchanged sequential balance demand stagnation is equally premature. The closing stock reflects commitments signed at different times that have not yet been fully performed. It carries history while also responding to current execution. Readers generally want to know whether future work is being renewed; the stock alone does not answer that question.
Our interpretation is that this disclosure provides an opportunity to test the match between replenishment and completion, rather than classify demand with a single directional adjective. The difference between annual and sequential movement is itself an economic observation requiring explanation. Removing one comparison to make the conclusion simpler loses information.
Grouping contracts by signing period makes the question specific
Suppose a business signed an unusually large, long agreement in an earlier quarter. It could retain a sizeable balance without immediately signing another of similar scale. Conversely, as old work is performed, a stable balance could mean new commitments are replacing what has been completed. Both paths can sit inside the same unchanged total, but their implications for future coverage differ.
The next analytical step is consequently to distinguish the vintages of the work, rather than convert the closing total into another apparently precise growth rate. How quickly are older commitments running down? When should newly signed work begin contributing? Does a renewal extend an existing relationship or enlarge its scope? These are questions proposed here, not a claim that the company has disclosed a contract ledger sufficient to answer them.
Signing-period groups and customer groups also solve different problems. One customer can sign in several periods, while one period can contain many customers. A prominent customer name does not reconstruct the replenishment rate; a quarterly addition does not reveal concentration. The two dimensions need to constrain one another rather than allow a memorable deal to represent the entire business.
Lower bookings are a separate clue, not an explanation of the stock
The annual decline in the bookings metric deserves attention because it cautions against equating old commitments with current business momentum. But the starting point matters. If agreements clustered in the comparison year and are more evenly distributed now, growth could look weak. If customers actually reduced new purchases, a similar direction could appear. Those explanations require different evidence. Plausibility is not confirmation.
For an operating team, the distinction changes the response. A shift in signing dates calls for checking whether subsequent agreements are progressing as expected; a smaller renewal scope calls for understanding why customers bought less. Outside readers normally have less access. They can track subsequent periods, consistency in management explanations and whether related revenue appears on the expected schedule. Missing detail is not treated here as a negative fact.
Microsoft’s annual report links subscription revenue to service periods, consumption revenue to utilization, and RPO estimates to judgments about variable consideration and renegotiation. Thus, even a signing-period breakdown would not justify assuming identical revenue-conversion speeds across groups. This accounting context limits inference; it does not explain the current quarter’s movement by itself.
Ask which interpretation later evidence could test
A constructive interpretation is that previously accumulated work is maturing and new agreements support delivery without expanding the closing stock materially. A more cautious interpretation is that new commitments no longer sustain the previous expansion, while historical accumulation temporarily masks slower replenishment. The latest totals do not settle the choice. Both conditions could also exist in different products or customer groups.
Useful subsequent observations would strengthen or weaken an explanation. If older work advances and recent commitments keep replacing it, maturation gains support. If replenishment remains weak over several periods and coverage shortens, future visibility needs reassessment. These are conditional analytical tests, not forecasts of next quarter. Any conclusion still needs to be reconciled with disclosure scope, contract amendments and changes in business coverage.
The tension among three comparisons is what deserves to survive the headline: strong annual growth from an older starting point, a nearly unchanged stock over the latest quarter, and an annual decline in bookings. Reading them separately, then asking which periods and activities each measures, is more informative than collapsing everything into “strong” or “slowing.” The next disclosure matters for what it reveals about new work replacing old work, not merely whether it refreshes a larger total.
Open Market Notes analysis. The hypothetical sequence explains comparison methods; it is not a company forecast or investment recommendation.
Information only. No investment, legal, tax, or financial advice.