Before a market price becomes evidence
A market chart needs more than a number: its observation rule determines which claims the data can support.
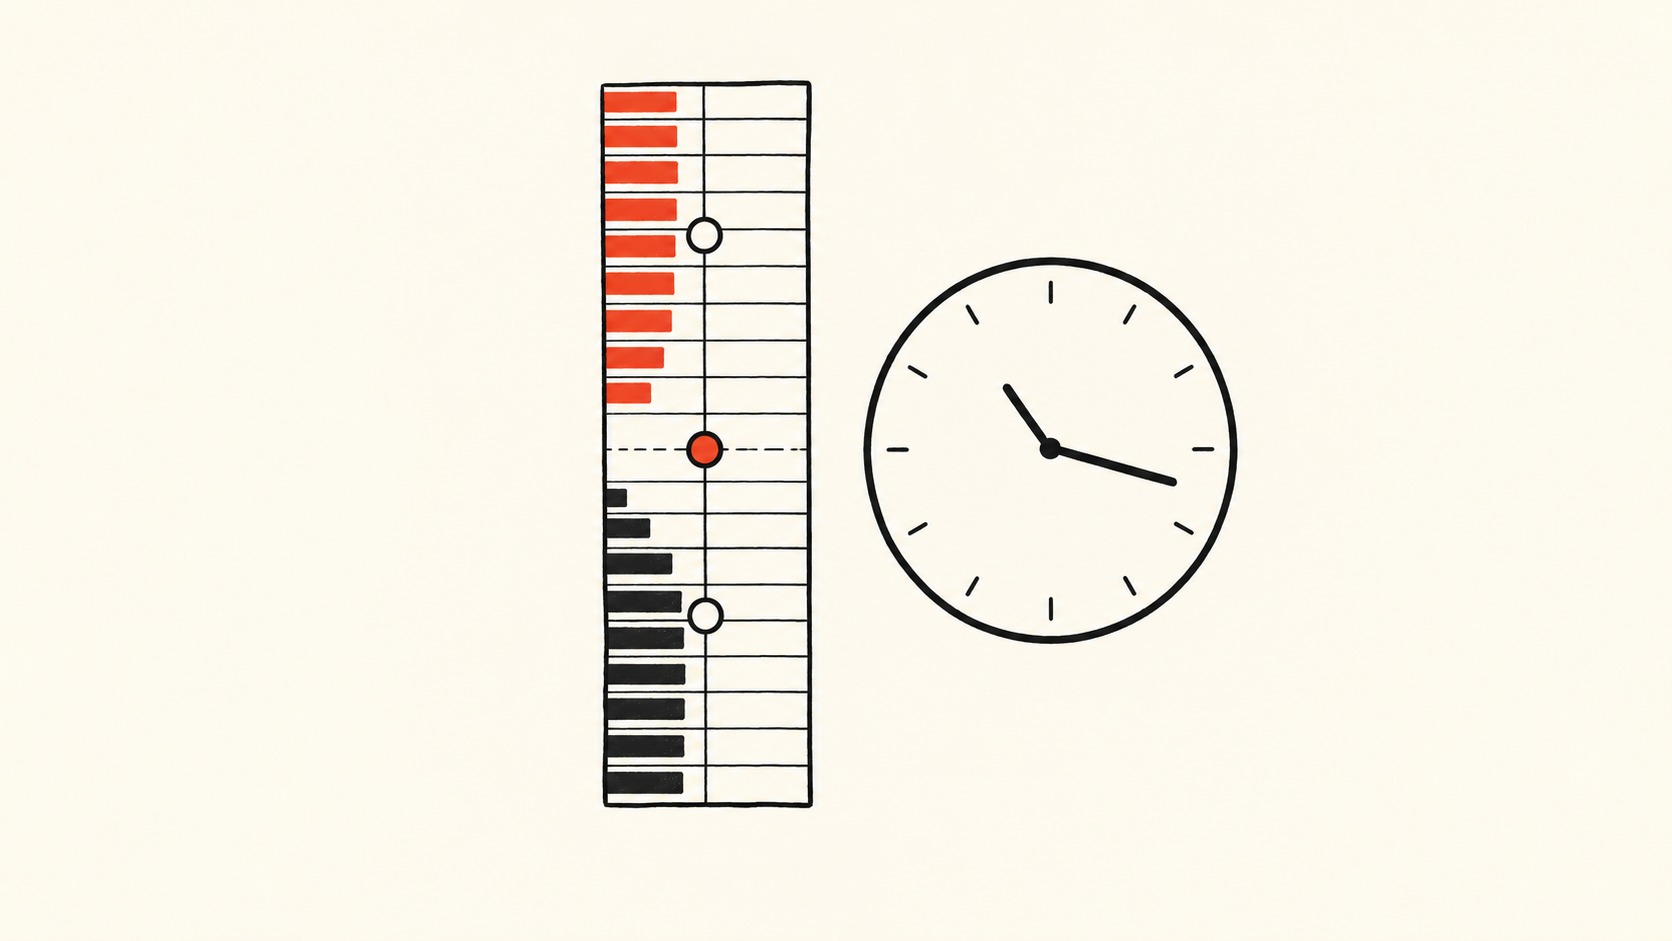
A smooth market chart can give an analyst a false sense of continuity. Its dots may come from different observation rules, different clocks, or a changing population of instruments. Even when every recorded number is genuine, the resulting story can be wrong. The first question is therefore not whether the line rose, but whether the observations on either side of that rise mean the same thing.
Dune announced live market-data feeds on October 22, 2026, covering a defined catalog rather than all on-chain trades. That is a useful occasion to examine a broader analytical problem, not evidence that the provider's data is defective. Wider access makes it easier to build a chart; it does not determine what the chart measures. The distinction matters especially when prediction-market prices become inputs to news coverage, dashboards, and business decisions.
A displayed probability is an observation with a rule
Polymarket's March 13, 2026 explanation says its display uses the bid–ask midpoint, switching to the last trade when the spread exceeds ten cents. This is a specific presentation rule, not a universal definition of market belief.
Consider a deliberately simplified, hypothetical data service. At one moment it reports the center of current quotes; later it reports an earlier completed transaction. A line joining those observations looks like a single price series. Yet the earlier dot describes what participants are presently quoting, while the later dot describes something someone previously did. A change in the line can contain both a market change and a change in the measuring instrument. A commentator who attributes the whole movement to new information has skipped a necessary step.
This does not make either observation useless. The midpoint describes a location between two quotes; a transaction shows that a trade occurred. Their usefulness depends on the question. Neither, by itself, tells a reader how much could have been traded at the displayed number, whether the observation was fresh, or how representative it was of the relevant market. A dashboard should preserve these distinctions instead of hiding them behind one percentage symbol.
The clock is part of the evidence
Imagine two collectors following the same market. One receives updates promptly, while the other temporarily loses its connection and catches up in a burst. If both charts use arrival time without saying so, the second may appear to show a sudden reaction that was actually spread over several minutes. If an analyst then compares the charts with a news publication timestamp, the inferred sequence can be reversed.
This is an illustrative failure mode, not a finding about any named platform. It explains why a usable record needs more than a date column. The time attached by the source, the time received by the collector, and the time when a chart was recomputed answer different questions. When one is unavailable, the gap should remain visible. Filling it with a convenient timestamp produces a complete-looking table while weakening the claim that can be made from it.
A corrected history also needs an identity. A chart downloaded on Monday may differ from the version retrieved on Friday after corrections or additions. Neither must be fraudulent. But a published assertion should be tied to the version that supported it, with later corrections explained. Otherwise two people can reproduce the same calculation on different records and mistake a data revision for a disagreement about economics.
More rows do not necessarily mean a broader market
Suppose a researcher builds an index from a fixed set of hypothetical markets, then expands the list midway through the month. The newly added markets happen to be more active. Average activity rises even if activity in every previously covered market is unchanged. The headline “participation accelerated” would require a distinction between growth inside the original population and growth in the population being measured.
There is no universally correct answer to whether new instruments belong in the index immediately. A product intended to describe today's available universe may reasonably include them. A study comparing behavior through time may need a stable cohort as well. The mistake is to use one series to answer both questions without disclosing the membership change. For business users, coverage policy is part of the product, not a technical footnote.
The same reasoning applies to duplicate-looking records. Removing similar rows mechanically may erase separate legitimate events; keeping every row may count repeated delivery as additional activity. The analyst needs an event identity appropriate to the source, rather than an assumption that resemblance proves duplication. A reconciliation report should distinguish records rejected, records corrected, and records whose status is unresolved.
These distinctions matter to data users as well as infrastructure teams. Departments discussing the same chart may disagree over whether demand rose or only the statistical coverage expanded. Aligning the sample and version first narrows the dispute to the genuine difference, rather than leaving people to exchange incompatible numbers.
A measurement result is not a motive
An October 5 preprint by Philipp D. Dubach shows that trade-direction classification can alter measured trading costs; the reported accounting quantities do not identify causal impact or private information. Its value here is a warning about inference, not a license to label particular traders informed or manipulative.
An unusual price movement can justify investigation. It does not supply the missing sequence of actions, the participants' information, or a counterfactual showing what would otherwise have happened. Nor does a clean dataset solve those questions automatically. Data validation and causal explanation are different jobs. Keeping them separate makes criticism more precise: a researcher can challenge a classification rule without alleging misconduct, and acknowledge a surprising pattern without claiming to know its cause.
For an editorial or corporate dashboard, the practical response is to make the claim travel with its measurement conditions. A percentage should identify the instrument and observation type; a trend should disclose its population and revision boundary; an explanation should state what evidence would distinguish it from alternatives. These are not decorations to add after a persuasive chart has been designed. They determine which chart is appropriate in the first place.
The reward is not perfect certainty. It is a smaller distance between what the records establish and what readers are asked to believe. This article offers an analytical framework, not a trading recommendation; its hypothetical examples are not reports of observed platform failures.
Information only. No investment, legal, tax, or financial advice.