Ingram Micro’s margins reveal two different kinds of scale
Distribution economics become clearer when order contribution is read alongside service workload and the time capital remains committed.
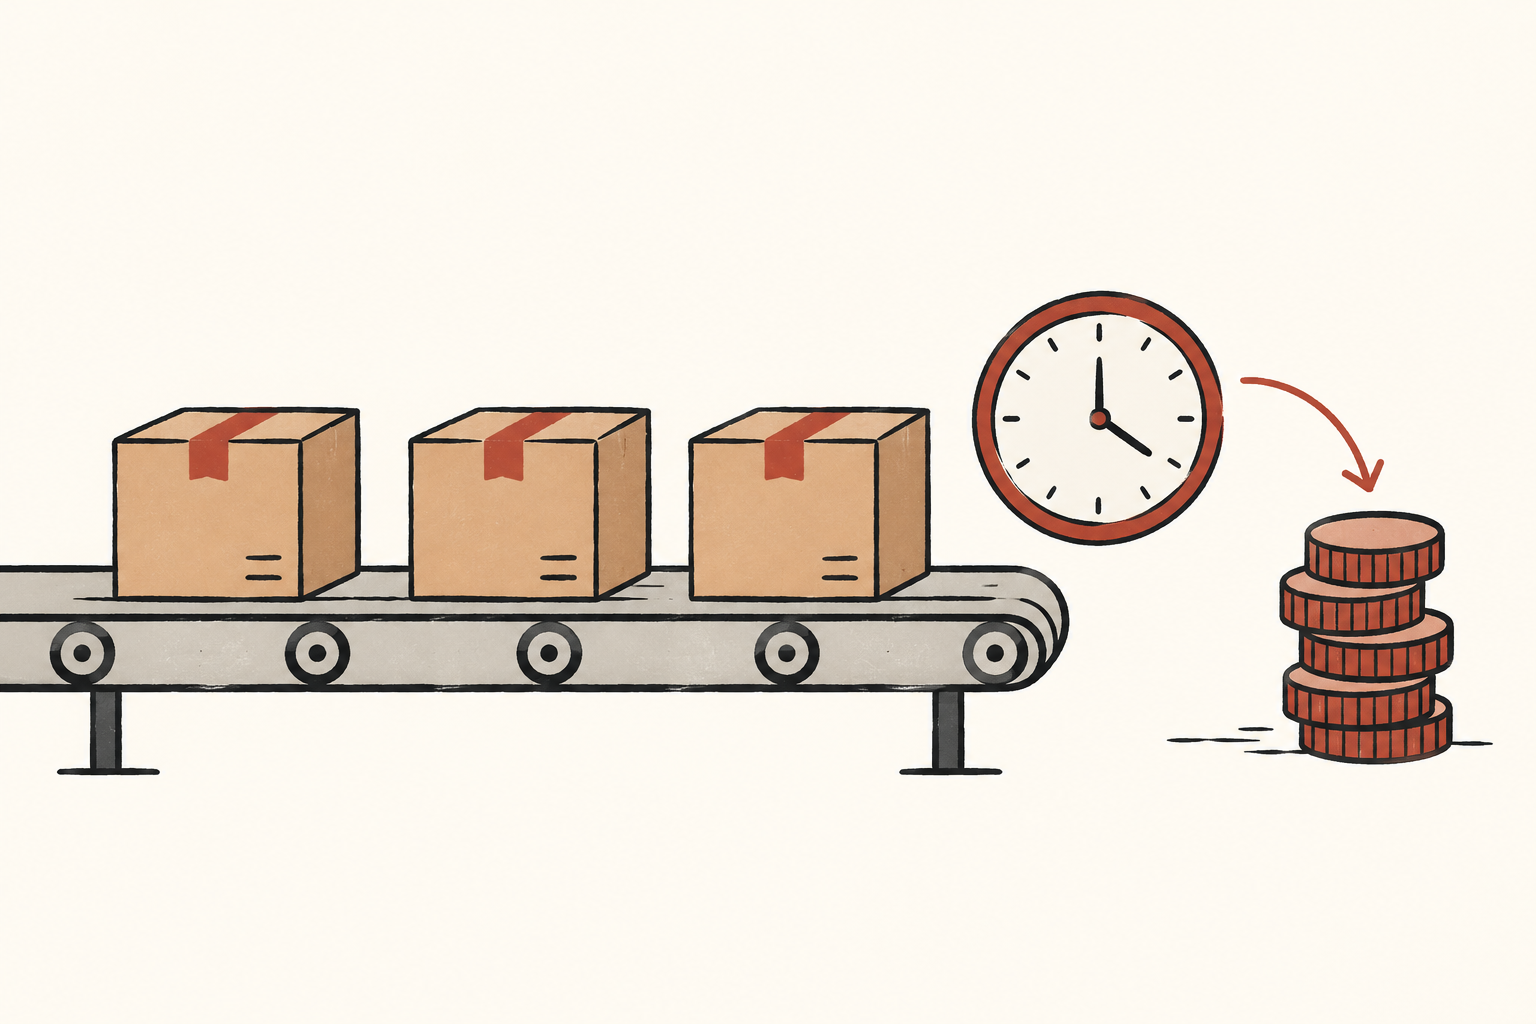
Ingram Micro’s income statement offers a useful way to examine a neglected question in distribution: how much service capacity and financing time do additional orders consume? Product markups alone miss the first constraint. Profit growth alone can miss the second.
Ingram’s October 29, 2026 release reports quarterly gross margin of 6.55%, versus 6.90% a year earlier; management cites lower-margin, lower-service-cost GPU/AI products.
Its 10-Q gives September 26 quarter GAAP operating margin of 1.93%, versus 1.77% a year earlier; 39-week operating cash outflow was approximately $1.260 billion.
These observations do not contradict one another. They describe different layers of the business and different time spans. What follows is Open Market Notes’ analysis of distribution economics, not a claim about undisclosed order profitability or customer collections.
An order carries two kinds of workload
Consider two entirely hypothetical orders. One is a batch of identical devices with clear delivery requirements. The other is smaller but requires repeated configuration checks, split shipments and several support handoffs. The first could contribute more after servicing costs despite its thinner percentage markup. The second’s higher gross margin might not compensate for the work involved. Neither is an actual Ingram customer example: the point is that sales value and processing effort are not interchangeable.
Changing the denominator helps. Gross profit per dollar of sales describes the product transaction. Staff and system effort per delivery describes the process. Contribution per unit of scarce service capacity gets closer to the resource decision involved in accepting business. Those measures can rank the same orders differently.
Low servicing cost also does not mean no cost. A standardized transaction can still encounter missing components, returns or credit reviews. If routine delivery costs are assigned to the order while exceptional work stays with a central team, the order looks lighter than it is. The managerial challenge is to return exception costs to the business that creates them, rather than allowing the fastest-growing activity to transfer hidden work elsewhere.
Operating leverage needs a complete-cycle test
Operating margin can improve while gross margin falls if the space left after operating expenses expands. But attributing that outcome entirely to durable efficiency requires further evidence. When existing systems have spare capacity, extra orders may not require proportionate support hiring. Once capacity is exhausted, another increment of growth may require an entire team, additional storage or another control process.
The cost curve is therefore not necessarily smooth. Lower expenses relative to revenue in one quarter may reflect better use of existing capacity, a favorable activity mix, timing or earlier investment. More revealing questions are whether the next group of orders can use the same process, whether exceptions remain stable and whether growth begins to impair delivery reliability. Public aggregate figures cannot substitute for those order-level answers.
A competing explanation is genuine process improvement. If work of comparable complexity needs fewer manual interventions without pushing errors or delays downstream, the efficiency gain is more persuasive. The appropriate comparison is not simply two periods with similar revenue. It is two sets of work with similar complexity and service commitments. That is a more demanding test than the expense ratio, and better separates process improvement from favorable mix.
Financing brings time back into the argument
An income statement aggregates transactions over a period. Funding pressure can arise before a transaction has completed its collection cycle. Imagine two hypothetical orders earning identical operating contributions. One collects from the buyer before paying the supplier; the other pays the supplier first and waits for customer acceptance and payment. Their income-statement economics could look similar while their demands on available cash differ substantially.
The operating question is therefore not only how much an order earns, but how long funds remain committed and who bears uncertainty during that interval. A larger invoice can require more money for the same waiting time. Delayed acceptance can turn an expected collection date into a range. These are general scenarios, not evidence of overdue accounts or abnormal inventory at Ingram.
Negative operating cash flow does not by itself establish that orders lack value; a positive figure does not by itself establish better growth quality. The former may accompany preparation for future deliveries, while the latter may reflect release of money committed earlier. The useful test is whether cash movements can be reconciled with order progress and whether recovery depends on continued rapid expansion. A quarter’s profit margin cannot summarize 39 weeks of cash movements.
Read profit alongside waiting
A useful follow-up framework puts order contribution, service complexity and funding duration together. Thin-margin business delivered reliably with limited support and timely collection can be an effective scale model. Higher-margin business that persistently ties up scarce specialists and funding may not be suitable for unlimited expansion. Conversely, necessary complex services may preserve long-term relationships; high immediate handling costs do not automatically make them wasteful.
Management must balance constraints: which commitments consume the hardest-to-replace capacity, which payment arrangements shorten funding delays, and which exceptions deserve expensive support. Revenue growth alone cannot resolve those choices. An AI-infrastructure label cannot replace analysis of the underlying transaction.
This disclosure opens an analytical question rather than settling the quality of every order. Evidence that operating improvements and cash recovery survive different demand conditions would strengthen the case for durable scale advantages. Until then, separating reported margins, period cash movements and untested explanations is more reliable than attaching a quick label to growth. This article makes no share-price judgment or investment recommendation.
Information only. No investment, legal, tax, or financial advice.