ASML’s Next Capacity Test Is at the Customer’s Fab
Following the same machines from shipment to sustained production reveals what equipment growth actually delivers.
Original analysis | October 14, 2026
ASML’s Q3 release invites a practical question: when does a machine become usable chipmaking capacity? Our view is that the most informative next disclosure would connect equipment leaving the supplier with dependable output at the customer. A shipment total cannot make that connection on its own.
Two primary documents provide a starting point. ASML’s 2025 annual report distinguishes delivery-based and customer-acceptance-based revenue recognition according to testing history. Its January presentation, page 16 connects EUV capacity with system count, throughput and availability. The framework below is our analytical extension, not a new company forecast.
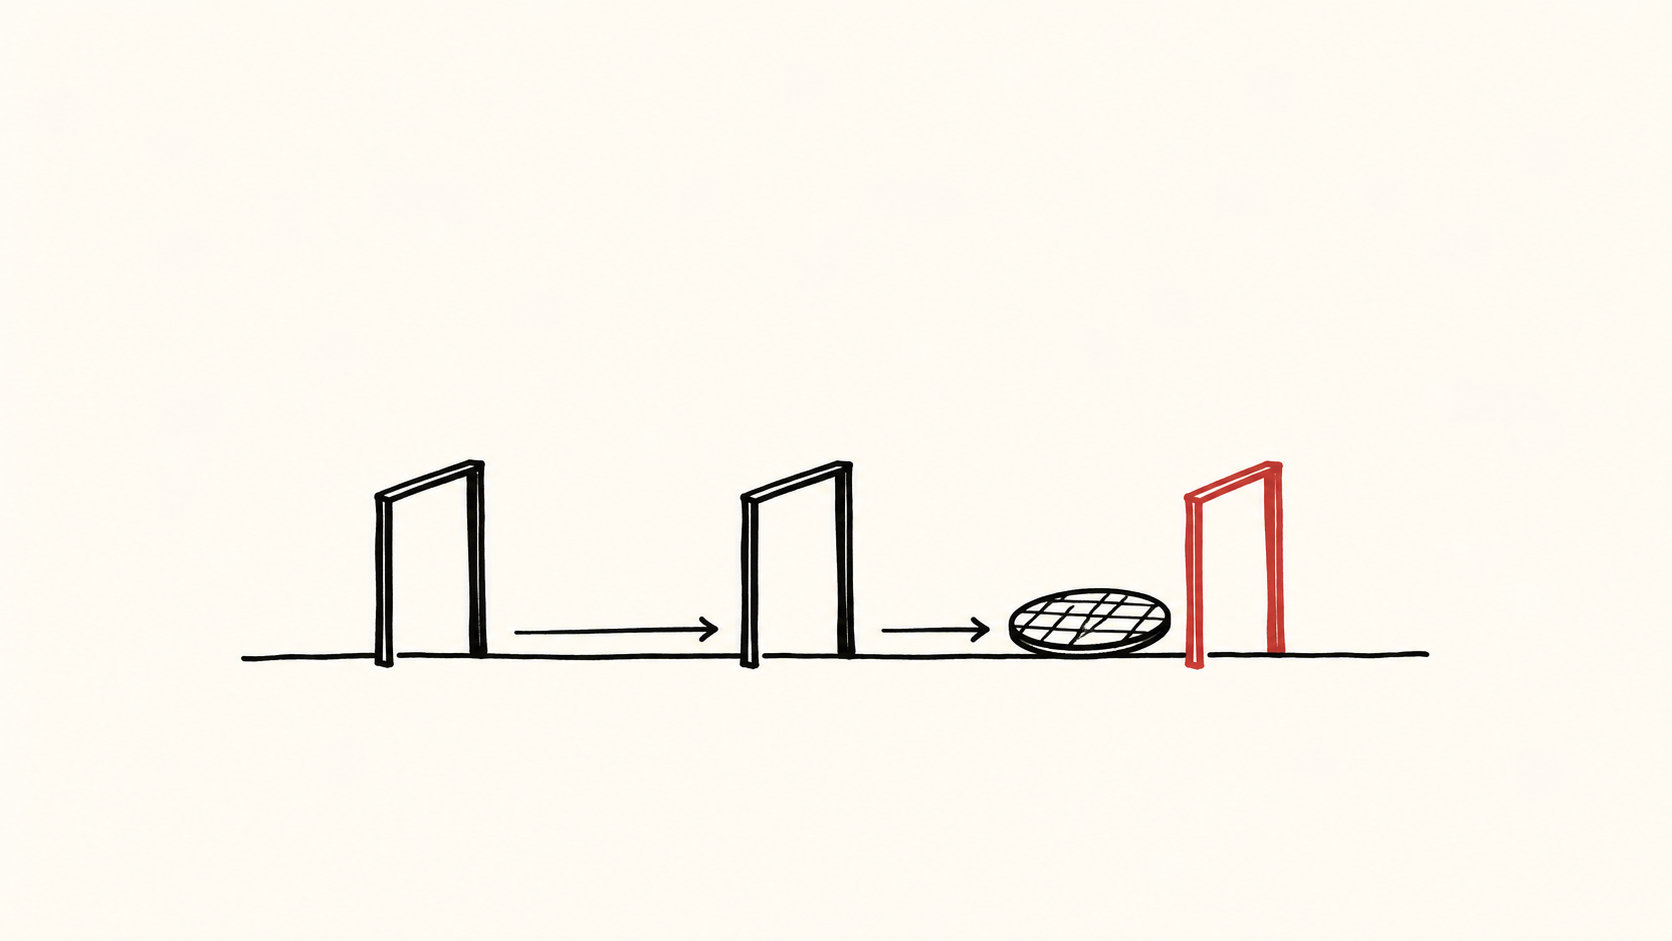
Follow a cohort through the factory gates
For each group of machines, record four events: shipment, completed installation, customer acceptance, and sustained production of the customer’s intended product. Then measure the time between them. These events answer different questions: where the asset is, whether it is ready, whether contractual requirements have been met, and whether it is contributing useful output.
This operational sequence is not a revenue-recognition rule. Equally, an accounting milestone should not be treated as a complete account of downstream production. Readers need both views without forcing them into the same calendar.
Cohort tracking matters. Suppose a quarter contains more shipments and more accepted tools, but the accepted tools mostly came from older shipments. Both totals can improve while the newest deliveries wait longer. Following the same machines reveals the queue that comparing quarterly totals can miss. The useful evidence would be the median delay, the slowest group, and the reason each stalled group is waiting.
Protect the denominator
Consider a deliberately simplified example, not ASML performance data. Ten identical machines process 100 wafer-passes per operating hour and are available for 80% of calendar time. Their theoretical available capacity is 800 passes per hour. Raise speed by 10% but reduce availability to 70%, and that becomes 770: 3.75% below the starting point.
The example assumes the machines are fully loaded when available. It omits scheduling losses, product mix, repeated process steps and yield. Even its 800 passes are not 800 finished wafers, much less 800 usable chips. The point is to demand a stable denominator before treating a faster specification as a proportional increase in saleable output.
A meaningful comparison would therefore hold the product and required processing route constant, or explain the change. Otherwise a richer product mix could consume more machine time while making better products. That would be a different economic outcome from a simple loss of operating efficiency.
Allocate scarce effort to the active constraint
A buyer choosing between a new machine and an upgrade should compare incremental qualified output over a common horizon, after installation downtime and implementation effort. The cheaper option per advertised unit of speed need not deliver the earliest useful capacity.
The same reasoning applies to service teams. If the binding constraint is installation, sending engineers to accelerate already-running tools may leave the critical queue unchanged. If availability is the constraint, clearing a recurring outage may release capacity without another shipment. If a later process is the bottleneck, faster lithography may mainly build work in progress. These are conditional cases, not findings about any named fab.
The decision should change when the constraint moves. A plan that maximizes output this month might be unsuitable for a new product ramp next year. Separate those horizons rather than calling either plan universally efficient.
What would change our assessment
Evidence of shorter installation-to-production delays for comparable cohorts, alongside stable availability and product-qualified output, would strengthen the case that equipment expansion is becoming usable supply. Higher shipments alone would leave the conversion question open. Rising revenue with weak downstream disclosure would be an information gap, not proof of operational failure.
For investors and buyers, the practical discipline is to ask which stage each number measures. Equipment demand, supplier revenue and customer output are related, but they are not interchangeable. This framework evaluates execution; it does not establish a fair share price or forecast a shortage’s duration.
Information only. No investment, legal, tax, or financial advice.